


Unlock the secrets to business growth and data-driven decision-making with the power of analytics tools! In today’s fast-paced digital landscape, understanding your audience, website performance, and marketing campaign effectiveness is no longer a luxury – it’s a necessity. This comprehensive guide will delve into the world of analytics, exploring the essential tools that can transform raw data into actionable insights, helping you optimize your strategies and achieve your business goals.
Why You Need Analytics Tools
Understanding User Behavior
Analytics tools provide invaluable insights into how users interact with your website or application. This information helps you to understand their behavior patterns and improve their experience. For example, you can track which pages are most popular, how long users spend on each page, and where they click. This data reveals user preferences, pain points, and areas for improvement.
- Website Navigation: Track user flow to identify bottlenecks in your website navigation. For example, if many users drop off at the same step in a checkout process, it signals a usability issue.
- Content Performance: Analyze which content resonates best with your audience based on engagement metrics like time spent, social shares, and comments.
- Heatmaps: Use heatmaps to visualize where users click, scroll, and pay attention on your web pages, revealing crucial insights for optimizing layout and content placement.
- Session Recordings: Record user sessions to see exactly how users interact with your website, allowing you to identify usability issues and friction points that may be hindering conversions.
Measuring Marketing Campaign Effectiveness
Analytics tools are essential for measuring the success of your marketing campaigns. By tracking key performance indicators (KPIs) like click-through rates, conversion rates, and return on investment (ROI), you can optimize your campaigns for maximum impact. Without these tools, you’re essentially flying blind.
- Attribution Modeling: Understand which marketing channels contribute most to conversions using attribution models like first-touch, last-touch, or multi-touch attribution.
- A/B Testing: Experiment with different ad creatives, landing pages, or call-to-actions to determine which variations perform best and maximize conversion rates. For example, test two different headlines for your ad to see which drives more clicks.
- Conversion Tracking: Set up conversion tracking to monitor the number of users who complete desired actions, such as filling out a form, making a purchase, or subscribing to a newsletter.
- ROI Calculation: Accurately measure the return on investment (ROI) of your marketing spend by tracking the revenue generated from each campaign.
Making Data-Driven Decisions
One of the biggest benefits of analytics tools is their ability to transform raw data into actionable insights. Instead of relying on gut feelings, you can base your decisions on solid data, increasing your chances of success. Data-driven decisions lead to more effective strategies and better outcomes.
- Predictive Analytics: Use predictive analytics to forecast future trends and behaviors based on historical data, enabling you to proactively adjust your strategies.
- Segmentation: Segment your audience based on demographics, behavior, or other criteria to tailor your marketing messages and offers to specific groups.
- Reporting: Generate custom reports to track key metrics and monitor progress towards your business goals. Many tools offer automated reporting features to save time and effort.
Essential Analytics Tools
Google Analytics
Google Analytics is a free and powerful web analytics tool that provides comprehensive insights into website traffic, user behavior, and conversion rates. It’s a must-have for any business with an online presence.
- Key Features:
Real-time data tracking
Audience insights (demographics, interests)
Behavior analysis (pageviews, bounce rate, time on site)
Conversion tracking (goals, e-commerce tracking)
Custom reports and dashboards
- Practical Example: Use Google Analytics to identify pages with high bounce rates. These pages are potential candidates for improvement. Investigate the content, design, and user experience of these pages to identify areas for optimization.
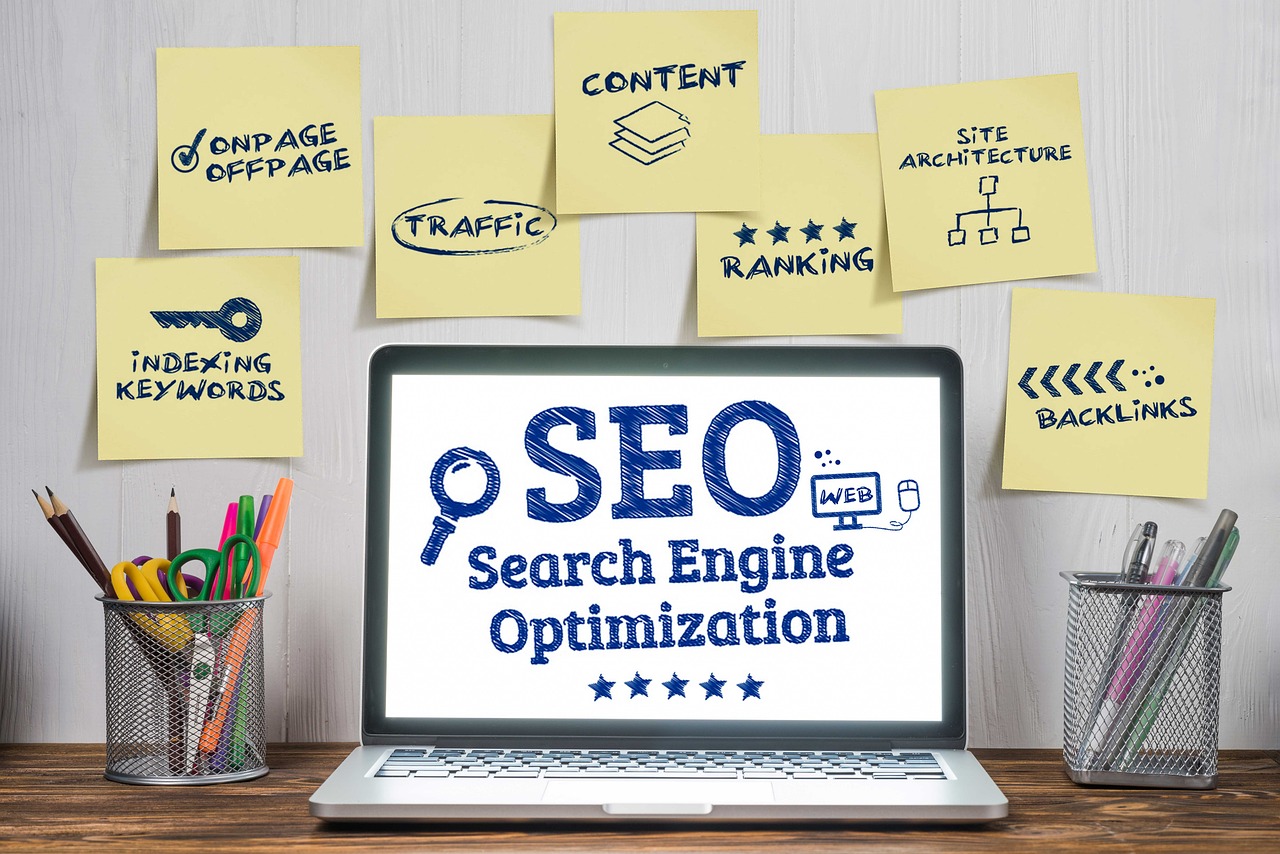
Google Search Console
Google Search Console is a free tool that helps you monitor and maintain your site’s presence in Google Search results. It provides valuable insights into your website’s performance, including crawl errors, search queries, and mobile usability issues.
- Key Features:
Index coverage reports
Search performance reports
Mobile usability testing
Sitemap submission
Security issue alerts
- Practical Example: Use Google Search Console to identify keywords that are driving traffic to your website. Optimize your content for these keywords to improve your search engine rankings and attract more organic traffic.
Adobe Analytics
Adobe Analytics is a comprehensive analytics platform designed for enterprise-level businesses. It offers advanced features for data collection, analysis, and reporting, enabling businesses to make data-driven decisions and optimize their customer experiences.
- Key Features:
Real-time data collection
Advanced segmentation
Multi-channel analysis
Predictive analytics
Custom dashboards and reports
- Practical Example: Use Adobe Analytics to track customer journeys across multiple channels, such as web, mobile, and email. Identify the touchpoints that contribute most to conversions and optimize your marketing efforts accordingly.
Social Media Analytics Tools
Social media analytics tools provide insights into your social media performance, allowing you to track engagement, reach, and follower growth. These tools help you understand what type of content resonates with your audience and optimize your social media strategy.
- Examples:
Facebook Insights: Tracks engagement, reach, and demographics for your Facebook page.
Twitter Analytics: Provides data on tweet performance, follower growth, and audience demographics.
Instagram Insights: Offers insights into post engagement, reach, and follower demographics.
Third-Party Tools: Platforms like Hootsuite, Buffer, and Sprout Social offer integrated social media analytics features.
- Practical Example: Use social media analytics to identify the best times to post on social media. Analyze your past performance data to determine when your audience is most active and engaged, and schedule your posts accordingly.
Implementing Analytics: Best Practices
Setting Clear Goals
Before implementing any analytics tool, it’s essential to define your goals and objectives. What do you want to achieve with your data? What KPIs are most important to track? Having clear goals will help you focus your efforts and ensure that you’re collecting the right data.
- Examples of Goals:
Increase website traffic by 20% in the next quarter.
Improve conversion rates by 10% in the next month.
Reduce bounce rate by 5% in the next two months.
Increase customer engagement on social media by 15% in the next three months.
Defining Key Performance Indicators (KPIs)
Key Performance Indicators (KPIs) are the metrics that you’ll use to measure your progress towards your goals. Choose KPIs that are relevant to your business objectives and that can be tracked effectively. Regularly monitor your KPIs to identify trends and areas for improvement.
- Examples of KPIs:
Website traffic (pageviews, sessions, unique visitors)
Conversion rate (percentage of visitors who complete a desired action)
Bounce rate (percentage of visitors who leave your website after viewing only one page)
Time on site (average amount of time visitors spend on your website)
Customer acquisition cost (the cost of acquiring a new customer)
Customer lifetime value (the total revenue you expect to generate from a customer)
Ensuring Data Accuracy
Accurate data is essential for making informed decisions. Ensure that your analytics tools are properly configured and that data is being collected correctly. Regularly audit your data to identify and correct any errors or inconsistencies.
- Tips for Ensuring Data Accuracy:
Verify that your tracking code is installed correctly on all pages of your website.
Implement filters to exclude internal traffic and bot traffic.
Regularly review your data for anomalies or inconsistencies.
Use data validation tools to check for errors and inaccuracies.
Regularly Reviewing and Analyzing Data
Collecting data is only the first step. It’s crucial to regularly review and analyze your data to identify trends, patterns, and insights. Use this information to optimize your strategies and improve your business performance.
- Tips for Analyzing Data:
Set aside time each week or month to review your analytics data.
Look for trends and patterns in your data.
Compare your data to previous periods to identify areas of improvement.
Use data visualization tools to create charts and graphs that make your data easier to understand.
Share your insights with your team and use them to inform your decision-making.
Advanced Analytics Techniques
Segmentation and Cohort Analysis
Segmentation involves dividing your audience into smaller groups based on specific criteria, such as demographics, behavior, or purchase history. Cohort analysis involves grouping users based on when they joined or started using your product or service and tracking their behavior over time.
- Benefits of Segmentation:
Personalized marketing messages
Targeted advertising campaigns
Improved customer engagement
Increased conversion rates
- Benefits of Cohort Analysis:
Identify patterns in user behavior over time.
Understand how different groups of users interact with your product or service.
Optimize your onboarding process to improve user retention.
A/B Testing and Multivariate Testing
A/B testing involves comparing two versions of a web page, ad, or email to see which one performs better. Multivariate testing involves testing multiple variations of multiple elements simultaneously.
- Benefits of A/B Testing:
Improved conversion rates
Increased engagement
Reduced bounce rate
Better user experience
- Benefits of Multivariate Testing:
Identify the optimal combination of elements for maximizing performance.
Gain a deeper understanding of how different elements interact with each other.
Predictive Analytics and Machine Learning
Predictive analytics uses statistical techniques to forecast future trends and behaviors based on historical data. Machine learning is a type of artificial intelligence that allows computers to learn from data without being explicitly programmed.
- Applications of Predictive Analytics:
Predict customer churn
Identify potential fraud
Optimize pricing strategies
Forecast demand
- Applications of Machine Learning:
Personalize recommendations
Automate customer service
Improve search results
* Detect anomalies
Conclusion
Data is the new oil, and analytics tools are the refineries that turn raw data into valuable fuel for your business. By understanding the importance of analytics, implementing the right tools, and following best practices, you can unlock the power of data-driven decision-making and achieve your business goals. Start today by exploring the tools mentioned in this guide, setting clear goals, and consistently analyzing your data. Your future success depends on it!


Leave a comment